–
Were Hitler’s National Socialists Really Socialists?
How should Nazism be classified, particularly when compared to socialism? Are these ideologies at opposite ends of a spectrum, or are they simply different sides of the same collectivist coin?
 In my humble opinion, both views are correct, which is why I think this triangle is the best way to classify various ideologies.
Nazis are motivated by race hatred and the socialists are motivated by class hatred, so they basically are at opposite ends at the bottom of the triangle.
But both ideologies are against free markets and both put the state over the individual, so they are far away from libertarianism(or classical liberalism) when looking from top to bottom.
These different ways of looking at the issue explain why Glenn Kessler of the Washington Post created a controversy when he decided to “fact check” this statement from gadfly Congresswoman Marjorie Taylor Greene.

According to Kessler, Greene deserved “four Pinocchios” for asserting that Hitler and the Nazis were socialists.
The full name of Hitler’s party was Nationalsozialistische Deutsche Arbeiterpartei. In English, that translates to National Socialist German Workers’ Party. But it was not a socialist party; it was a right-wing, ultranationalist party dedicated to racial purity, territorial expansion and anti-Semitism — and total political control.
…the 1920 Nazi party platform…there are…passages denouncing banks, department stores and “interest slavery.” That could be seen as “a quasi-Marxist rejection of free markets. But these were also typical criticisms in the anti-Semitic playbook …Hitler adamantly rejected socialist ideas, dismantled or banned left-leaning parties and disapproved of trade unions. …We suggest Greene brush up on her history… She earns Four Pinocchios.
This is a remarkable. The Nazis called themselves socialists, yet Kessler says Greene is lying for saying the same thing.
I’m not the only one to notice this bizarre example of media bias.
Professor Hannes Gissurarson from Iceland debunked Kessler’s hack analysis.
A ‘fact-checker’ at Washington Post, Glenn Kessler, asserts that a Republican Member of the House of Representatives is wrong in a recent comment on Hitler’s national socialism. It is not, as she had said, a branch of socialism. Kessler writes that the German Nazi Party, despite its name (the National-Socialist Workers’ Party), ‘was not a socialist party…’
In support of his case, Kessler quotes the first eight of the 25 points in the 1920 Nazi political programme… He lukewarmly concedes that in the Nazi programme there were also passages denouncing capitalism. But why does he not quote them as well? …It is hard not to discern the socialist overtones in these points. Why did the Washington Post fact-checker not quote them in full like the first eight? …according to Hayek national socialism could be considered to be the rebellious socialism of the lower middle class… Traditional socialists, democrats as well as communists, shared with Hitler’s national socialists the belief that conscious organisation had to replace the spontaneous order… Hayek is certainly right that there are strong family resemblances between traditional socialism and national socialism. Both are totalitarian creeds.
Professor David Henderson also eviscerated Kessler’s sloppy column.
Glenn Kessler, the Post‘s official fact checker, …analyzes various statements and claims to determine whether they are true. If he finds them false, he awards them Pinocchios, with the number of Pinocchios depending on
the degree of falsehood. The highest number of Pinocchios he awards is 4. On May 29, Glenn Kessler earned his own Pinocchios. …Nazis…really were a socialist party. …Kessler attempts to buttress his case by listing the first 8 of 25 planks in the 1920 Nazi Party platform. Those planks do help his case that the Nazis were anti-Semitic (duh) and nationalists (ditto duh). But what about the other 17 planks? …pretty socialistic.
Here are some of those planks that Kessler conveniently omitted.
11. Abolition of unearned (work and labour) incomes. Breaking of rent-slavery. …
13. We demand the nationalization of all (previous) associated industries (trusts).
14. We demand a division of profits of all heavy industries.
15. We demand an expansion on a large scale of old age welfare. …
17. We demand a land reform suitable to our needs, provision of a law for the free expropriation of land for the purposes of public utility, abolition of taxes on land and prevention of all speculation in land.
Henderson also zings Kessler for using a misleading quote from Martin Niemoller.
By the way, the Nazis didn’t merely advocate for socialism in an early platform. They also implemented statist policies once they took power.
Back in 2007, Michael Moynihan wrote about the Nazi welfare state in a book review for Reason.
…the Nazis maintained popular support—a necessary precondition for the “final solution”—not because of terror or ideological affinity but through a simple system of “plunder,” “bribery,” and a generous welfare state. …Requisitioned Jewish property, resources stolen from the conquered, and punitive taxes levied on local businesses insulated citizens from shortages and allowed the regime to create a “racist-totalitarian welfare state.”
…To understand Hitler’s popularity, …”it is necessary to focus on the socialist aspect of National Socialism.” …Adolf Eichmann viewed National Socialism and communism as “quasi-siblings,” explaining in his memoirs that he “inclined towards the left and emphasized socialist aspects every bit as much as nationalist ones.” As late as 1944, Propaganda Minister Josef Goebbels publicly celebrated “our socialism,” reminding his war-weary subjects that Germany “alone [has] the best social welfare measures.” Contrast this, he advised, with the Jews, who were the very “incarnation of capitalism.” …Hitler implemented a variety of interventionist economic policies, including price and rent controls, exorbitant corporate taxes, frequent “polemics against landlords,” subsidies to German farmers…and harsh taxes on capital gains, which Hitler himself had denounced as “effortless income.”
The bottom line is that the Nazis are justifiably hated for reasons that have nothing to do with economic policy.
But it’s also true that their economic policy was a version of socialism (fascism involves government control rather than government ownership, but the result is the same).
Here are two videos from Prager University for those who want more information. First, we can learn about communism and Nazism.
Second, we can learn about the history of fascism.
Let’s wrap up by quoting George Will on the interrelated ideas of fascism, Nazism, and socialism.
Fascism…was a recoil against Enlightenment individualism: the idea that good societies allow reasoning, rights-bearing people to define for themselves the worthy life. …Mussolini, a fervent socialist
until his politics mutated into a rival collectivism, distilled fascism to this: “Everything within the state, nothing outside the state, nothing against the state.” The Nazi Party — the National Socialist German Workers’ Party — effected a broad expansion of socialism’s agenda…
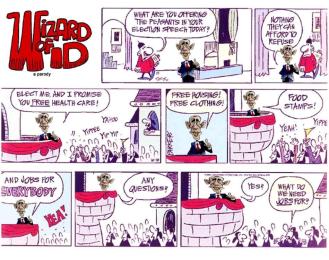
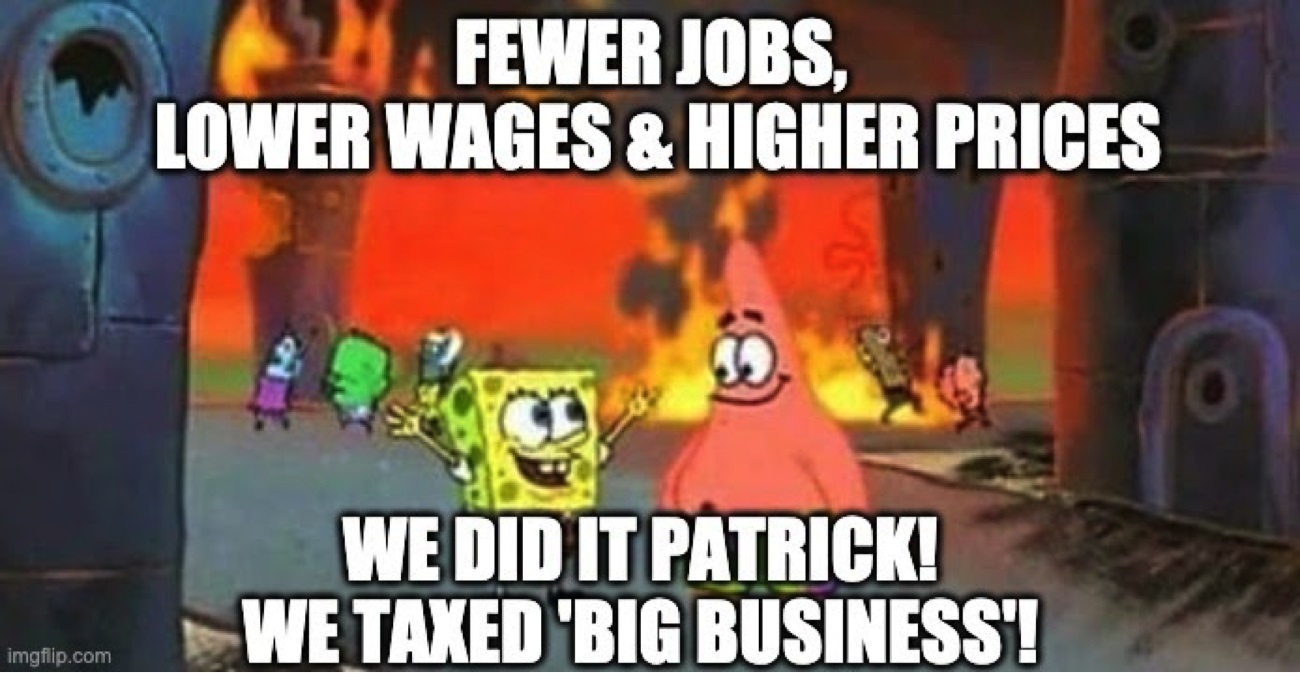
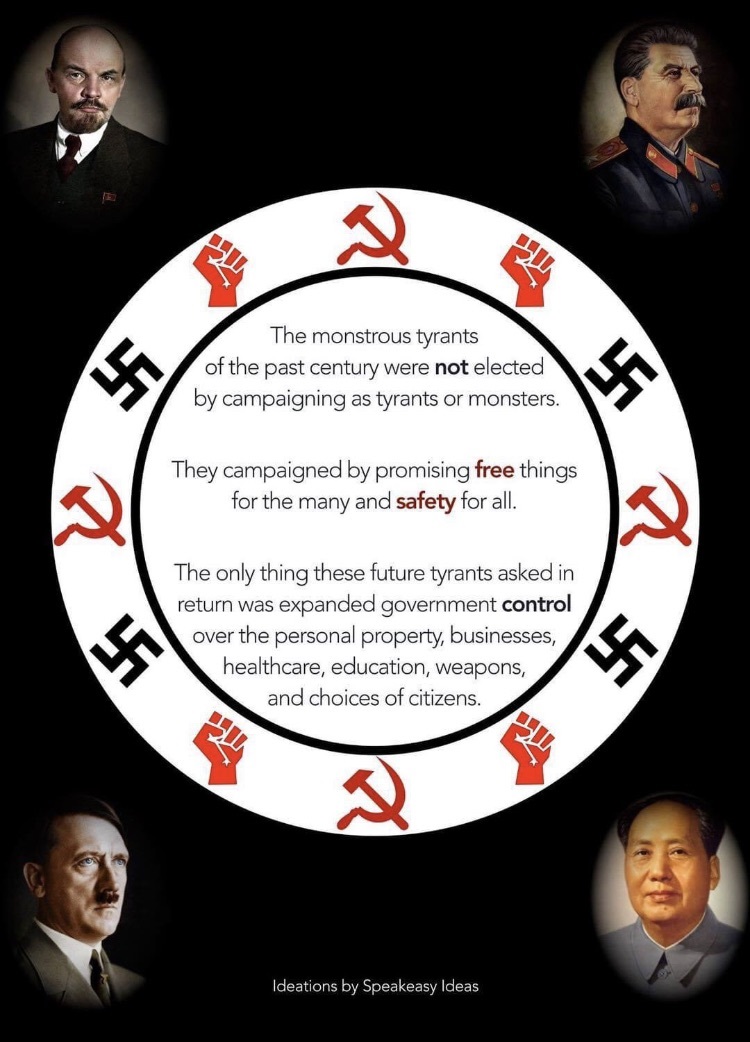
Last, but not least, here’s a reminder that we should be very wary of demagogues who promise goodies.
P.S. Kessler should have “fact checked” the last part of Rep. Greene’s statement. As much as I dislike “democratic socialism,” today’s Democrats are not trying to impose a totalitarian system.
Prosperity and Taxation: What Can We Learn from the 1930s
The United States conducted an experiment in the 1980s. Reagan dramatically lowered the top tax rate on households, dropping it from 70 percent to 28 percent.
Folks on the left bitterly resisted Reagan’s “supply-side” agenda, arguing that “the rich won’t pay enough” and “the government will be starved of revenue.”
Fortunately, we can look at IRS data to see what happened to tax payments from those making more than $200,000 per year.
Lo and behold, it turns out that Reaganomics was a big success. Uncle Sam collected five times as much money when the rate was slashed.

As I’ve previously written, this was the Laffer Curve on steroids. Even when you consider other factors (population growth, inflation, other reforms, etc), there’s little doubt that we got a big “supply-side effect” from Reagan’s tax reforms.
Now Biden wants to run this experiment in reverse.
Based on basic economics, his approach won’t succeed. But let’s augment theory by examining what actually happened when Hoover and Roosevelt raised tax rates in the 1930s.
Alan Reynolds reviewed tax policy in the 1920s and 1930s, but let’s focus on what he wrote about the latter decade. He starts with some general observations.
Large increases in marginal tax rates on incomes above $50,000 in the 1930s were almost always matched by large reductions in the amount of high income reported and taxed…
An earlier generation of economists found that raising tax rates on incomes, profits, and sales in the 1930s was inexcusably destructive. In 1956, MIT economist E. Cary Brown pointed to the “highly deflationary impact” of the Revenue Act of 1932, which pushed up rates virtually across the board, but notably on the lower‐and middle‐income groups.
He then gets to the all-important issue of higher tax rates leading to big reductions in taxable income.
In Figure 1, the average marginal tax rate is an unweighted average of statutory tax brackets applying to all income groups reporting more than $50,000 of income. After President Hoover’s June 1932 tax increase (retroactive to January) the number of tax brackets above $50,000 quadrupled from 8 to 32, ranging from 31 percent to 63 percent. The average of many marginal tax rates facing incomes higher than $50,000 increased from 21.5 percent in 1931 to 47 percent in 1932, and 61.9 percent in 1936. One of the most striking facts in Figure 1 is that the amount of reported income above $50,000 was almost cut in half in a single year—from $1.31 billion in 1931 to $776.7 million in 1932.
Here’s the aforementioned Figure 1. You can see that taxable income soared when tax rates were slashed in the 1920s.
But when tax rates were increased in the 1930s, taxable income collapsed and never recovered.
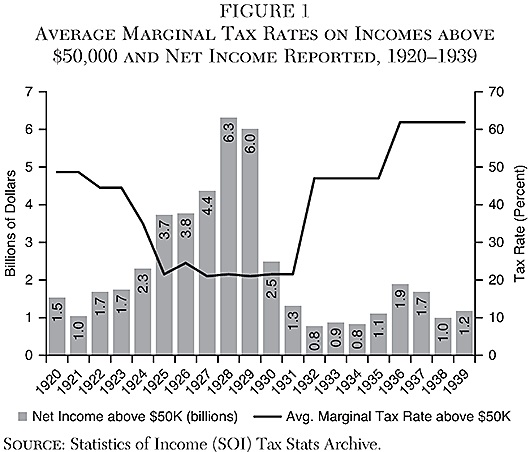
What’s the lesson from this chart? As Alan explained, the lesson is that high tax rates lead to rich people earning and declaring less taxable income (they still have that ability today).
In the eight years from 1932 to 1939, the economy was in cyclical contraction for only 28 months. Even in 1940, after two huge increases in income tax rates, individual income tax receipts remained lower ($1,014 million) than they had been in the 1930 slump ($1,045 million) when the top tax rate was 25 percent rather than 79 percent. Eight years of prolonged weakness in high incomes and personal tax revenue after tax rates were hugely increased in 1932 cannot be easily brushed away as merely cyclical, rather than a behavioral response to much higher tax rates on additional (marginal) income. Just as income (and tax revenue) from high‐income taxpayers rose spectacularly after top tax rates fell from 1921 to 1928, high incomes and revenue fell just as spectacularly in 1932 when top tax rates rose.
One big takeaway is that Hoover and FDR were two peas in a pod.
Both imposed bad tax policy.
From 1930 to 1937, unlike 1923–25, virtually all federal and state tax rates on incomes and sales were repeatedly increased, and many new taxes were added, such as the Smoot‐Hawley tariffs in 1930, taxes on alcoholic beverages in December 1933, and a Social Security payroll tax in 1937. Annual growth of per capita GDP from 1929 to 1939 was essentially zero. …To summarize: all the repeated increases in tax rates and reductions of exemptions enacted by presidents Hoover and Roosevelt in 1932–36 did not even manage to keep individual income tax collections as high in 1939–40 (in dollars or as a percent of GDP) as they had been in 1929–30. The experience of 1930 to 1940 decisively repudiated any pretense that doubling or tripling marginal tax rates on a much broader base proved to be a revenue‐maximizing plan.
Alan closes with an observation that should raise alarm bells.
It turns out that the higher tax rates on the rich were simply the camel’s nose under the tent. The real agenda was extending the income tax to those with more modest incomes.
The most effective and sustained changes in personal taxes after 1931 were not the symbolic attempts to “soak the rich,” but rather the changes deliberately designed to convert the income tax from a class tax to a mass tax. The exemption for married couples was reduced from $3,500 to $2,500 in 1932, $2,000 in 1940, and $1,500 in 1941. Making more low incomes taxable quadrupled the number of tax returns from 3.7 million in 1930 to 14.7 million in 1940… The lowest tax rate was also raised from 1.1 percent to 4 percent in 1932, 4.4 percent in 1940, and 10 percent in 1941.
The same thing will happen today if Biden succeeds in raising taxes on the rich. Those tax hikes won’t collect much revenue, but politicians will increase spending anyhow. They’ll then use high deficits as an excuse for higher taxes on lower-income and middle-class taxpayers (some of the options include financial taxes, carbon taxes, and value-added taxes).
Lather, rinse, repeat. Until the United States is Europe. And that will definitely be bad news for ordinary people.
P.S. Here’s what we can learn about tax policy in the 1920s. And the 1950s.
P.P.S. The 1920s and 1930s also can teach us an important lesson about growth and inequality.
Sloppy or Dishonest Fiscal Analysis from the Washington Post
Good fiscal policy means low tax rates and spending restraint.
 And that’s a big reason why I’m a fan of Reaganomics.
Unlike other modern presidents (including other Republicans), Reagan successfully reduced the tax burden while also limiting the burden of government spending.
President Biden wants to take the opposite approach.
A few days ago, Dan Balz of the Washington Post provided some “news analysis” about Biden’s fiscal agenda. Some of what he wrote was accurate, noting that the president wants to increase spending by an additional $6 trillion over the next 10 years.
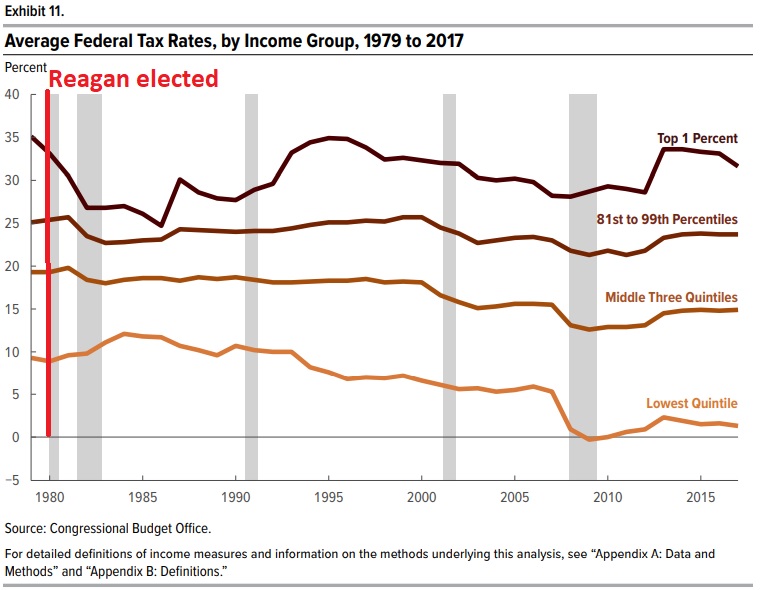
Reagan’s small-government philosophy resulted in a decades-long squeeze on the federal government, especially domestic spending, and on tax policies that mainly benefited the wealthiest Americans. …Government spending on social safety-net programs has been reduced compared with previous years.
Balz is wrong, wildly wrong.
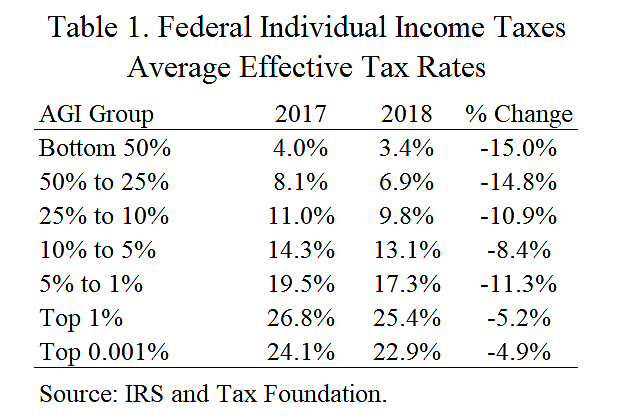
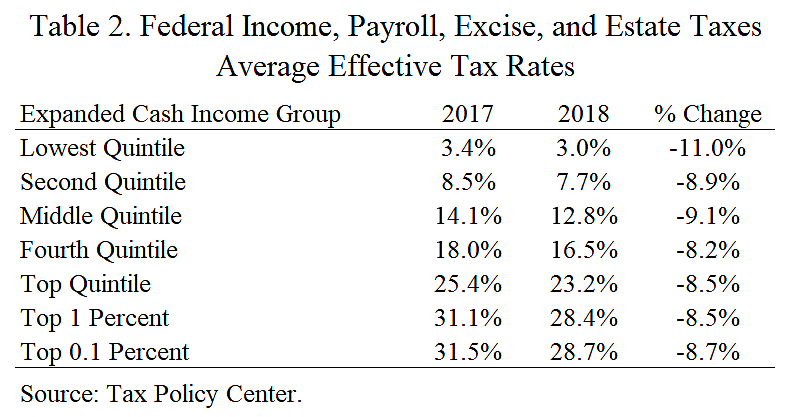
You don’t have to take my word for it. Here’s a chart, taken from an October 2020 report by the Congressional Budget Office. As you can see, people in the lowest income quintile have been the biggest winners,, with their average tax rate dropping from about 10 percent to about 2 percent..
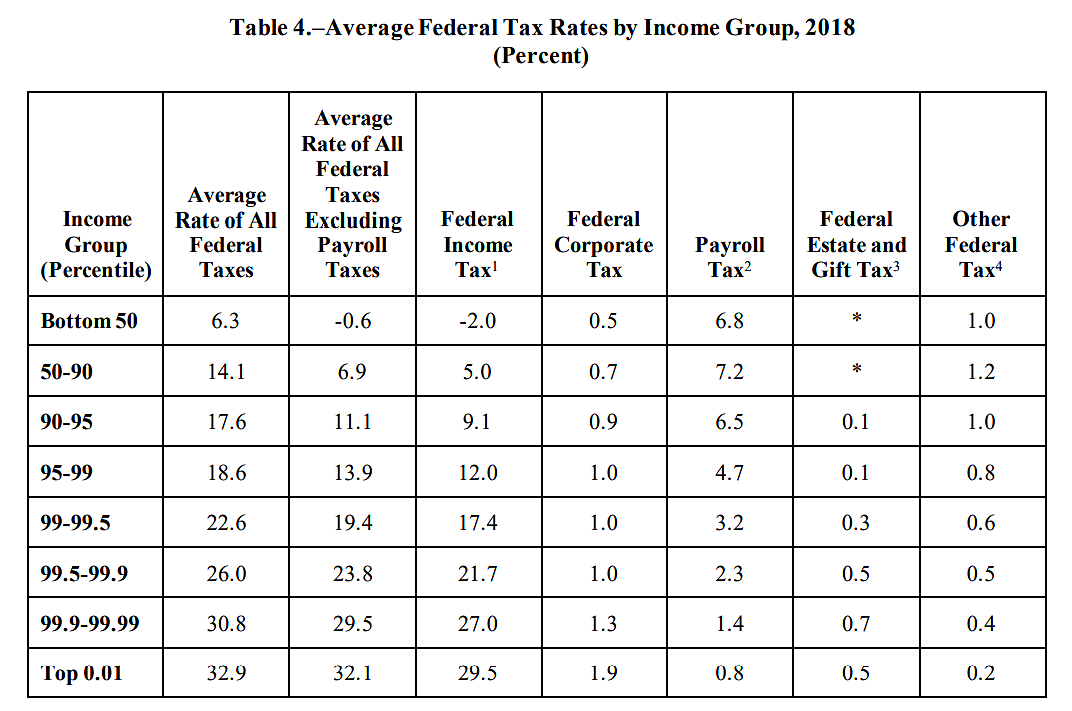
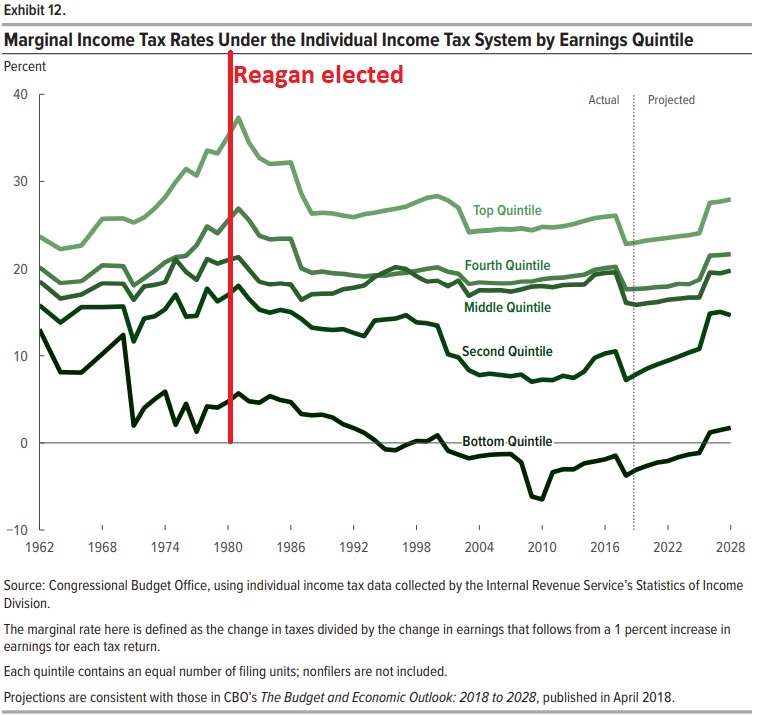
Here’s a chart showing marginal tax rates from a January 2019 CBO report. As you can see, Reagan lowered marginal tax rates for everyone, but Balz’s assertion that the rich got the lion’s share of the benefits is hard to justify considering that people in the bottom quintile now have negative marginal tax rates.
Balz’s mistakes on tax policy are significant.
But his biggest error (or worst dishonesty) occurred when he wrote about a “decades-long squeeze” on domestic spending and asserted that “spending on social safety-net programs has been reduced.”
A quick visit to the Office of Management and Budget’s Historical Tables is all that’s needed to debunk this nonsense. Here’s a chart, based on Table 8.2, showing the inflation-adjusted growth of entitlements and domestic discretionary programs.
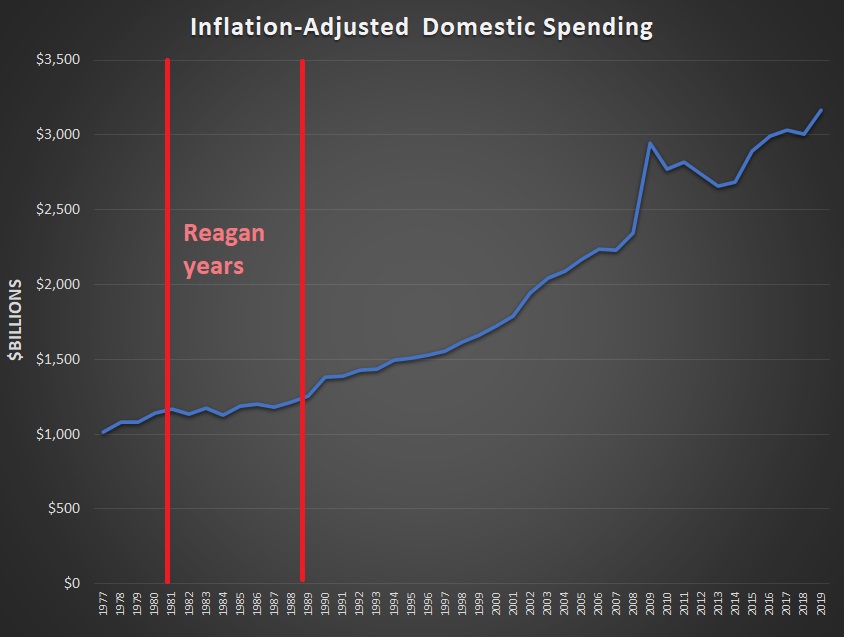
Call me crazy, but I’m seeing a rapid increase in domestic spending after Reagan left office.
P.S. There’s a pattern of lazy/dishonest fiscal reporting at the Washington Post.
P.P.S. I also can’t resist noting that Balz wrote how Biden wants to “invest” in social welfare programs, as if there’s some sort of positive return from creating more dependency. Reminds me of this Chuck Asay cartoon from the Obama years.
March 3, 2021
President Biden c/o The White House
1600 Pennsylvania Avenue NW
Washington, DC 20500
Dear Mr. President,
______________________________
Dan Mitchell shows how ignoring the Laffer Curve is like running a stop sign!!!!
Can You Spell L-A-F-F-E-R C-U-R-V-E?
July 12, 2013 by Dan Mitchell
I’m thinking of inventing a game, sort of a fiscal version of Pin the Tail on the Donkey.
Only the way it will work is that there will be a map of the world and the winner will be the blindfolded person who puts their pin closest to a nation such asAustralia or Switzerland that has a relatively low risk of long-run fiscal collapse.
 That won’t be an easy game to win since we have data from the BIS, OECD, and IMF showing that government is growing far too fast in the vast majority of nations.
We also know that many states and cities suffer from the same problems.
A handful of local governments already have hit the fiscal brick wall, with many of them (gee, what a surprise) from California.
The most spectacular mess, though, is about to happen in Michigan.
The Washington Post reports that Detroit is on the verge of fiscal collapse.
After decades of sad and spectacular decline, it has come to this for Detroit: The city is $19 billion in debt and on the edge of becoming the nation’s largest municipal bankruptcy. An emergency manager says the city can make good on only a sliver of what it owes — in many cases just pennies on the dollar.
This is a dog-bites-man story. Detroit’s problems are the completely predictable result of excessive government. Just as statism explains the problems of Greece. And the problems of California. And the problems of Cyprus. And theproblems of Illinois.
I could continue with a long list of profligate governments, but you get the idea. Some of these governments are collapsing at a quicker pace and some at a slower pace. But all of them are in deep trouble because they don’t follow my Golden Rule about restraining the burden of government spending so that it grows slower than the private sector.
![]() Detroit obviously is an example of a government that is collapsing sooner rather than later.
Detroit obviously is an example of a government that is collapsing sooner rather than later.
Why? Simply stated, as the size and scope of the public sector increased, that created very destructive economic and political dynamics.
More and more people got lured into the wagon of government dependency, which puts an ever-increasing burden on a shrinking pool of producers.
Meanwhile, organized interest groups such as government bureaucrats used their political muscle to extract absurdly excessive compensation packages, putting an even larger burden of the dwindling supply of taxpayers.
But that’s not the main focus of this post. Instead, I want to highlight a particular excerpt from the article and make a point about how too many people are blindly – perhaps willfully – ignorant of the Laffer Curve.
Check out this sentence.
Property tax collections are down 20 percent and income tax collections are down by more than a third in just the past five years — despite some of the highest tax rates in the state.
This is a classic “Fox Butterfield mistake,” which occurs when someone fails to recognize a cause-effect relationship. In this case, the reporter should have recognized that tax collections are down because Detroit has very high tax rates.
The city has a lot more problems than just high tax rates, of course, but can there be any doubt that productive people have very little incentive to earn and report taxable income in Detroit?
And that’s the essential insight of the Laffer Curve. Politicians can’t – or at least shouldn’t – assume that a 20 percent increase in tax rates will lead to a 20 percent increase in tax revenue. They also have to consider the degree to which a higher tax rate will cause a change in taxable income.
In some cases, higher tax rates will discourage people from earning more taxable income.
In some cases, higher tax rates will discourage people from reporting all the income they earn.
In some cases, higher tax rates will encourage people to utilize tax loopholes to shrink their taxable income.
In some cases, higher tax rates will encourage migration, thus causing taxable income to disappear.
Here’s my three-part video series on the Laffer Curve. Much of this is common sense, though it needs to be mandatory viewing for elected officials (as well as the bureaucrats at the Joint Committee on Taxation).
The Laffer Curve, Part I: Understanding the Theory
Uploaded by afq2007 on Jan 28, 2008
The Laffer Curve charts a relationship between tax rates and tax revenue. While the theory behind the Laffer Curve is widely accepted, the concept has become very controversial because politicians on both sides of the debate exaggerate. This video shows the middle ground between those who claim “all tax cuts pay for themselves” and those who claim tax policy has no impact on economic performance. This video, focusing on the theory of the Laffer Curve, is Part I of a three-part series. Part II reviews evidence of Laffer-Curve responses. Part III discusses how the revenue-estimating process in Washington can be improved. For more information please visit the Center for Freedom and Prosperity’s web site: http://www.freedomandprosperity.org
Part 2
Part 3
P.S. Just in case it’s not clear from the videos, we don’t want to be at the revenue-maximizing point on the Laffer Curve.
P.P.S. Amazingly, even the bureaucrats at the IMF recognize that there’s a point when taxes are so onerous that further increases don’t generate revenue.
P.P.P.S. At least CPAs understand the Laffer Curve, probably because they help their clients reduce their tax exposure to greedy governments.
P.P.P.P.S. I offered a Laffer Curve lesson to President Obama, but I doubt it had any impact.
___________________________
Thank you so much for your time. I know how valuable it is. I also appreciate the fine family that you have and your commitment as a father and a husband.
Sincerely,
Everette Hatcher III, 13900 Cottontail Lane, Alexander, AR 72002, ph 501-920-5733,
Williams with Sowell – Minimum Wage

Thomas Sowell
Thomas Sowell – Reducing Black Unemployment

—-

Related posts:
Dan Mitchell: Question of the Week: Has the European Fiscal Crisis Ended?
We got to cut spending or we will be in a fiscal crisis like Greece!!! Question of the Week: Has the European Fiscal Crisis Ended? January 12, 2013 by Dan Mitchell I’ve frequently commented on Europe’s fiscal mess and argued that excessive government spending is responsible for both the sovereign debt crisis and the economic stagnation […]
Taxes made simple by Dan Mitchell of the Cato Institute
The Flat Tax: How it Works and Why it is Good for America Uploaded by afq2007 on Mar 29, 2010 This Center for Freedom and Prosperity Foundation video shows how the flat tax would benefit families and businesses, and also explains how this simple and fair system would boost economic growth and eliminate the special-interest […]
Cartoons from Dan Mitchell’s blog that demonstrate what Obama is doing to our economy (Obama’s out of control spending not helped by raising taxes on rich)
I have put up lots of cartoons from Dan Mitchell’s blog before and they have got lots of hits before. Many of them have dealt with the economy, eternal unemployment benefits, socialism, Greece, welfare state or on gun control. President Obama really does think that all his answers lie in raising taxes on the rich when the […]
Dan Mitchell of the Cato Institute gives overview of economic policy and he praises Clinton and Reagan
__________ President Reagan, Nancy Reagan, Tom Selleck, Dudley Moore, Lucille Ball at a Tribute to Bob Hope’s 80th birthday at the Kennedy Center. 5/20/83. __________________________ Dan Mitchell is very good at giving speeches and making it very simple to understand economic policy and how it affects a nation. Mitchell also talks about slowing the growth […]
Cartoons from Dan Mitchell’s blog that demonstrate what Obama is doing to our economy (cartoon on entitlements)
The Laffer Curve – Explained Uploaded by Eddie Stannard on Nov 14, 2011 This video explains the relationship between tax rates, taxable income, and tax revenue. The key lesson is that the Laffer Curve is not an all-or-nothing proposition, where we have to choose between the exaggerated claim that “all tax cuts pay for themselves” […]
Open letter to President Obama (Part 296) (Laffer curve strikes again!!)
President Obama c/o The White House 1600 Pennsylvania Avenue NW Washington, DC 20500 Dear Mr. President, I know that you receive 20,000 letters a day and that you actually read 10 of them every day. I really do respect you for trying to get a pulse on what is going on out here. The way […]
Open letter to President Obama (Part 282, How the Laffer Curve worked in the 20th century over and over again!!!)
Dan Mitchell does a great job explaining the Laffer Curve President Obama c/o The White House 1600 Pennsylvania Avenue NW Washington, DC 20500 Dear Mr. President, I know that you receive 20,000 letters a day and that you actually read 10 of them every day. I really do respect you for trying to get a […]
Laffer curve hits tax hikers pretty hard (includes cartoon)
I have put up lots of cartoons from Dan Mitchell’s blog before and they have got lots of hits before. Many of them have dealt with the economy, eternal unemployment benefits, socialism, Greece, welfare state or on gun control. Today’s cartoon deals with the Laffer curve. Revenge of the Laffer Curve…Again and Again and Again March 27, 2013 […]
Editorial cartoon from Dan Mitchell’s blog on California’s sorry state of affairs
I have put up lots of cartoons from Dan Mitchell’s blog before and they have got lots of hits before. Many of them have dealt with the sequester, economy, eternal unemployment benefits, socialism, minimum wage laws, tax increases, social security, high taxes in California, Obamacare, Greece, welfare state or on gun control. President Obama’s favorite state must be California because […]
Portugal and the Laffer Curve
Class Warfare just don’t pay it seems. Why can’t we learn from other countries’ mistakes? Class Warfare Tax Policy Causes Portugal to Crash on the Laffer Curve, but Will Obama Learn from this Mistake? December 31, 2012 by Dan Mitchell Back in mid-2010, I wrote that Portugal was going to exacerbate its fiscal problems by raising […]
Political arguments against higher taxes from Dan Mitchell
Republicans would be stupid to raise taxes. Don’t Get Bamboozled by the Fiscal Cliff: Five Policy Reasons and Five Political Reasons Why Republicans Should Keep their No-Tax-Hike Promises December 6, 2012 by Dan Mitchell The politicians claim that they are negotiating about how best to reduce the deficit. That irks me because our fiscal problem is […]
President Obama ignores warnings about Laffer Curve
The Laffer Curve – Explained Uploaded by Eddie Stannard on Nov 14, 2011 This video explains the relationship between tax rates, taxable income, and tax revenue. The key lesson is that the Laffer Curve is not an all-or-nothing proposition, where we have to choose between the exaggerated claim that “all tax cuts pay for themselves” […]
Dan Mitchell looks at Obama’s tax record
Dan Mitchell’s article and the video from his organization takes a hard look at President Obama’s tax record. Dissecting Obama’s Record on Tax Policy October 30, 2012 by Dan Mitchell The folks at the Center for Freedom and Prosperity have been on a roll in the past few months, putting out an excellent series of videos […]
Dan Mitchell: “Romney is Right that You Can Lower Tax Rates and Reduce Tax Preferences without Hurting the Middle Class”
The Laffer Curve, Part I: Understanding the Theory Uploaded by afq2007 on Jan 28, 2008 The Laffer Curve charts a relationship between tax rates and tax revenue. While the theory behind the Laffer Curve is widely accepted, the concept has become very controversial because politicians on both sides of the debate exaggerate. This video shows […]
The Laffer Curve Wreaks Havoc in the United Kingdom
I got to hear Arthur Laffer speak back in 1981 and he predicted what would happen in the next few years with the Reagan tax cuts and he was right with every prediction. The Laffer Curve Wreaks Havoc in the United Kingdom July 1, 2012 by Dan Mitchell Back in 2010, I excoriated the new […]
Dan Mitchell: Maryland to Texas, but Not Okay to Move from the United States to Singapore?
You can’t blame someone for leaving one state for another if they have a better an opportunity to make money. Maryland to Texas, but Not Okay to Move from the United States to Singapore? July 12, 2012 by Dan Mitchell I’ve commented before about entrepreneurs, investors, and small business owners migrating from high tax states such […]
Liberals act like the Laffer Curve does not exist.
Raising taxes will not work. Liberals act like the Laffer Curve does not exist. The Laffer Curve Shows that Tax Increases Are a Very Bad Idea – even if They Generate More Tax Revenue April 10, 2012 by Dan Mitchell The Laffer Curve is a graphical representation of the relationship between tax rates, tax revenue, and […]
Dan Mitchell shows why soak-the-rich tax policy does not work
Dan Mitchell of the Cato Institute shows why Obama’s plan to tax the rich will not solve our deficit problem. Explaining in the New York Post Why Obama’s Soak-the-Rich Tax Policy Is Doomed to Failure April 17, 2012 by Dan Mitchell I think high tax rates on certain classes of citizens are immoral and discriminatory. If the […]
Dan Mitchell of the Cato Institute takes on liberals on PBS
You want the rich to pay more? Dan Mitchell observed:I explained that “rich” taxpayers declared much more income and paid much higher taxes after Reagan reduced the top tax rate from 70 percent to 28 percent. Liberals don’t understand good tax policies. Against 3-1 Odds, Promoting Good Tax Policy on Government TV April 12, 2012 by […]
Dan Mitchell of the Cato Institute takes on the Buffett Rule
Class warfare again from President Obama. Rejecting the Buffett Rule and Fighting Obama’s Class Warfare on CNBC April 10, 2012 by Dan Mitchell I’ve already explained why Warren Buffett is either dishonest or clueless about tax policy. Today, on CNBC, I got to debate the tax scheme that President Obama has named after the Omaha investor. […]
By Everette Hatcher III | Posted in Cato Institute, Taxes | Edit | Comments (0)