–
In One Image, Everything You Need to Know about Supply-Side Economics
When trying to educate someone about the importance of low marginal tax rates, what’s the most-convincing visual?
- A supply-and-demand graph?
- A philoso-raptor meme?
- A cartoon with two doors?
- A Dan Mitchell hypothetical?
I’m partial to the image I created, of course, but let’s look at a real-world example that is very compelling.
In an article about Tory tax policy for the U.K.-based Telegraph, Charlotte Gifford included a graph showing that a family with two children can have more disposable income with an income of £99,000 rather than an income of £144,000.
In other words, there’s a de facto 100 percent tax rate on the additional £45,000.
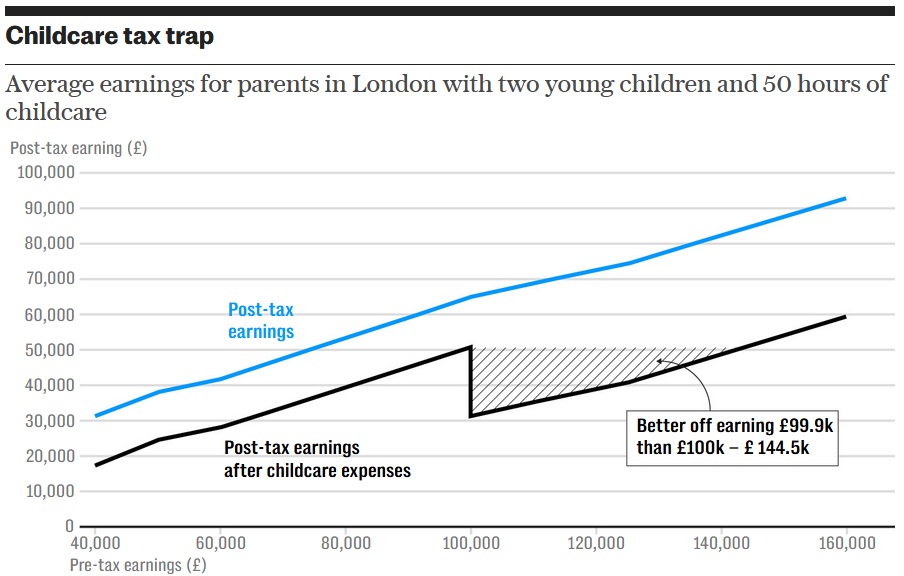
At the risk of understatement, there’s not much incentive to earn more income if the government imposes a de facto 100 percent tax rate.
That’s the kind of policy you expect to see in France, not the United Kingdom.
So why is it happening? Ms. Gifford explains.
High-earning parents are better off only working four days a week as bizarre tax rules mean it no longer pays to work. …One of the biggest distortions in the tax system occurs once a parent earns more than £100,000.
…One reader told The Telegraph they were considering shortening their working week from five days to four after realising they would keep more of their pay by earning £92,000 as opposed to £115,000. Reducing the working week makes perfect financial sense for many parents earning £100,000 or more. By working fewer days they would not only dodge the tax trap but also cut their childcare costs, which currently average at £285 per week full-time, or £13,695 a year.
If you want details, the de facto 100 percent-plus tax rate is the combined result of three factors.
- A statutory tax rate of 40 percent.
- The government’s clawback of the value of the personal allowance, pushing the effective marginal tax rate up to 60 percent. As stated in the article, “Once someone’s salary hits £100,000 they lose the personal allowance at a rate of £1 for every £2 until it disappears at £125,140.”
- The loss of a government handout. As Ms. Gifford wrote, “…once a parent earns more than £100,000…they lose their entitlement to free childcare… This creates a perverse incentive for parents earning £99,000 to turn down a pay rise so they can hold on to the government benefit.”
The moral of the story is that people respond to incentives.
When the government makes it less attractive for people to be more productive and earn more income, they respond by…drum roll, please…being less productive and not earning more income.
Which means less taxable income for the government (hello, Laffer Curve).
That’s the simple lesson of supply-side economics.
P.S. American readers should know that there are also examples of implicit 100 percent-plus effective marginal tax rates in the United States.
P.P.S. The United Kingdom has bad tax policy because it has bad spending policy.
P.P.P.S. To avoid these problems, nations should have flat taxes and limited government.
Washington’s Spending Problem
Three days ago, I explained that modest spending restraint could solve America’s fiscal problems.
In today’s column, let’s expand on that topic. We’ll start with this clip from a recent interview.
If you don’t want to spend a couple of minutes watching the interview, I made six points.
- We have a long-run fiscal problem.
- Spending is the problem, not red ink.
- A spending cap is the solution.
- Entitlement reform is needed.
- The alternative is massive tax hikes.
- Ordinary Americans will be pillaged,
For purposes of today’s column, I want to build on the second point.
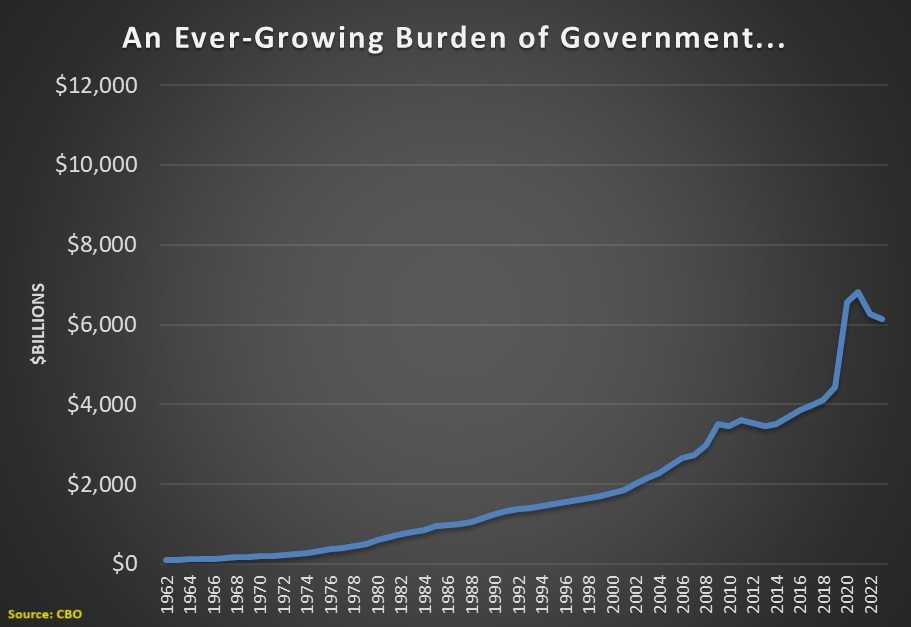
Here are two charts based on data from the Congressional Budget Office.
The first chart shows what has happened to federal spending over the past six decades. It shows a steadily increasing burden, punctuated with one-time spending sprees for the financial crisis (2008-2009) and the pandemic (2020-2021).
The second chart adds CBO’s projections for spending over the next 10 years, assuming the budget is left on autopilot.
As you can see, a bad situation will get much worse.
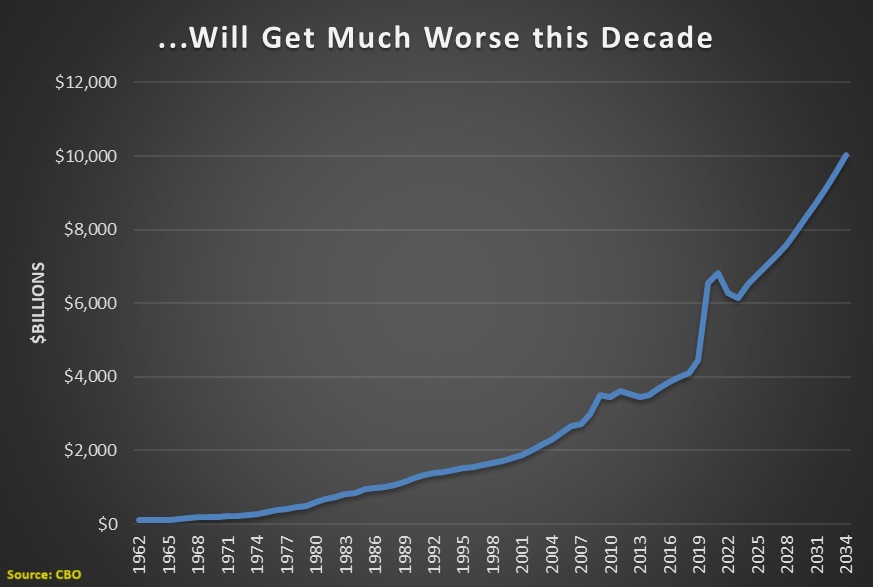
These are sobering charts.
But not necessarily frightening charts. If you adjust the numbers for inflation, the spending increase doesn’t look quite as bad.
And if you measure spending relative to the economy (share of GDP), the upward trend is further muted.
So the budget numbers are grim, but we have not passed a point of no return.
Heck, I wrote back in 2015 that Greece’s problems were solvable. And it that’s the case, then the same must be true in the United States. 
We just need to spendaholics in Washington to comply with the Golden Rule.
But that rosy scenario assumes politicians will try to solve the problem with spending restrain rather than making it worse with new spending burdens.
Sometimes I feel optimistic about achieving the former. But then I look at who is running for president (the Tweedledum and Tweedledee of big government) and it is much more realistic to expect the latter.
Lessons from Reaganomics for the 21st Century, Part V
Based on a study I authored for the Club for Growth Foundation, I’ve dedicated this week to a series about Reaganomics.
- Part I was about Reagan’s track record on spending and lessons for today.
- Part II was about Reagan’s track record on taxes and lessons for today.
- Part III was about Reagan’s track record on red tape and lessons for today.
- Part IV was about Reagan’s track record on inflation and lessons for today.
The main takeaway from those columns is that Reagan’s policies were very successful.
Which probably helps to explain why polling datashows that Reagan is still very popular with voters (you can see my favorite poll result here).
In a bizarre twist, however, there are some Republicans who think Reagan’s free-market principles are outdated.
These people call themselves national conservatives, though I think of them as reincarnated Rockefeller Republicans (what else would you call people who favor awful policies such as industrial policy and tax increases?).
Today’s column explains why they are wrong.
…many of Reagan’s reforms have been eroded over the past 30-plus years, and the United States is once again facing major economic challenges. Is it time for Reaganomics 2.0? Some argue that America faces different problems that require different solutions. They assert that pushing for the same policies is “Zombie Reaganism.”
Many of those critics are avowed leftists, so their antipathy is not surprising. But there are also some self-described conservatives who use the same term to express hostility. …To assess the merits of modern-day small-government conservatism, this paper will briefly explain the problems Reagan faced and the solutions he pursued, followed by an examination of today’s problems and the degree to which similar policies could and should apply. In short, America faces remarkably similar challenges to those that confronted President Reagan. …Policymakers who wish to boost middle-class incomes would be wise to emulate President Reagan.
For what it’s worth, I think some of the national conservatives are not statists. Instead, they merely think they should reject Reaganism for non-economic reasons.
So I included a section about being in favor of limited government regardless of views on other topics.
They assume support for Reagan-style small government conservatism:
- implies support for other policies adopted during the Reagan years, such as immigration amnesty.
- comes at the expense of conservative social policy.
- means no concern for the value of a defense industrial base.
- means being in favor of a “neoconservative” nation-building agenda.
- is somehow inconsistent with communitarian values.
This paper does not address those issues, other than to state that the desirability of Reagan’s four-pillar agenda does not depend on those other topics.
The bottom line is that everyone should be united by a desire for greater prosperity. And that explicitly implies being in favor of free markets and limited government.
P.S. The only hyphenated conservatism I like is small-government conservatism. In previous columns, I’ve pointed out the shortcomings of compassionate conservatism, kinder-and-gentler conservatism, common-good capitalism, and reform conservatism.
P.P.S. At the risk of understatement, Reagan was a not a small-government conservative in his younger days. Like a fine wine, however, he improved with age, migrating to the top-right of my Venn diagram.
Sloppy or Dishonest Fiscal Analysis from the Washington Post
Good fiscal policy means low tax rates and spending restraint.
 And that’s a big reason why I’m a fan of Reaganomics.
Unlike other modern presidents (including other Republicans), Reagan successfully reduced the tax burden while also limiting the burden of government spending.
President Biden wants to take the opposite approach.
A few days ago, Dan Balz of the Washington Post provided some “news analysis” about Biden’s fiscal agenda. Some of what he wrote was accurate, noting that the president wants to increase spending by an additional $6 trillion over the next 10 years.
Reagan’s small-government philosophy resulted in a decades-long squeeze on the federal government, especially domestic spending, and on tax policies that mainly benefited the wealthiest Americans. …Government spending on social safety-net programs has been reduced compared with previous years.
Balz is wrong, wildly wrong.
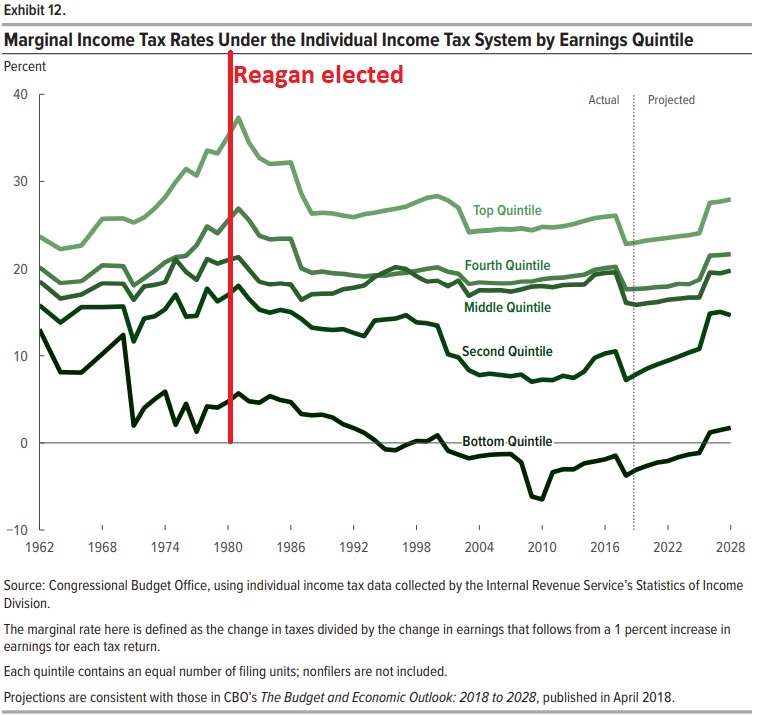
You don’t have to take my word for it. Here’s a chart, taken from an October 2020 report by the Congressional Budget Office. As you can see, people in the lowest income quintile have been the biggest winners,, with their average tax rate dropping from about 10 percent to about 2 percent..
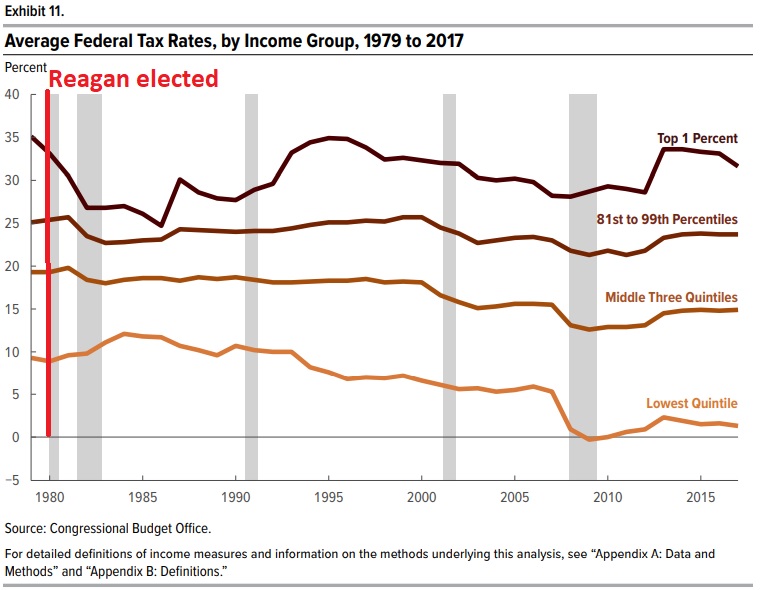
Here’s a chart showing marginal tax rates from a January 2019 CBO report. As you can see, Reagan lowered marginal tax rates for everyone, but Balz’s assertion that the rich got the lion’s share of the benefits is hard to justify considering that people in the bottom quintile now have negative marginal tax rates.
Balz’s mistakes on tax policy are significant.
But his biggest error (or worst dishonesty) occurred when he wrote about a “decades-long squeeze” on domestic spending and asserted that “spending on social safety-net programs has been reduced.”
A quick visit to the Office of Management and Budget’s Historical Tables is all that’s needed to debunk this nonsense. Here’s a chart, based on Table 8.2, showing the inflation-adjusted growth of entitlements and domestic discretionary programs.
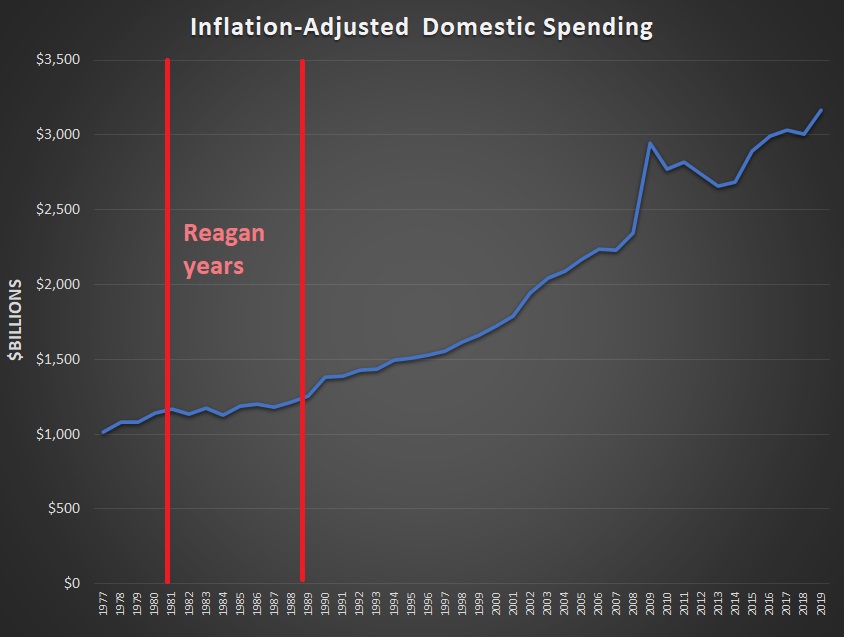
Call me crazy, but I’m seeing a rapid increase in domestic spending after Reagan left office.
P.S. There’s a pattern of lazy/dishonest fiscal reporting at the Washington Post.
P.P.S. I also can’t resist noting that Balz wrote how Biden wants to “invest” in social welfare programs, as if there’s some sort of positive return from creating more dependency. Reminds me of this Chuck Asay cartoon from the Obama years.
March 3, 2021
President Biden c/o The White House
1600 Pennsylvania Avenue NW
Washington, DC 20500
Dear Mr. President,
______________________________
Dan Mitchell shows how ignoring the Laffer Curve is like running a stop sign!!!!
Can You Spell L-A-F-F-E-R C-U-R-V-E?
July 12, 2013 by Dan Mitchell
I’m thinking of inventing a game, sort of a fiscal version of Pin the Tail on the Donkey.
Only the way it will work is that there will be a map of the world and the winner will be the blindfolded person who puts their pin closest to a nation such asAustralia or Switzerland that has a relatively low risk of long-run fiscal collapse.
 That won’t be an easy game to win since we have data from the BIS, OECD, and IMF showing that government is growing far too fast in the vast majority of nations.
We also know that many states and cities suffer from the same problems.
A handful of local governments already have hit the fiscal brick wall, with many of them (gee, what a surprise) from California.
The most spectacular mess, though, is about to happen in Michigan.
The Washington Post reports that Detroit is on the verge of fiscal collapse.
After decades of sad and spectacular decline, it has come to this for Detroit: The city is $19 billion in debt and on the edge of becoming the nation’s largest municipal bankruptcy. An emergency manager says the city can make good on only a sliver of what it owes — in many cases just pennies on the dollar.
This is a dog-bites-man story. Detroit’s problems are the completely predictable result of excessive government. Just as statism explains the problems of Greece. And the problems of California. And the problems of Cyprus. And theproblems of Illinois.
I could continue with a long list of profligate governments, but you get the idea. Some of these governments are collapsing at a quicker pace and some at a slower pace. But all of them are in deep trouble because they don’t follow my Golden Rule about restraining the burden of government spending so that it grows slower than the private sector.
![]() Detroit obviously is an example of a government that is collapsing sooner rather than later.
Detroit obviously is an example of a government that is collapsing sooner rather than later.
Why? Simply stated, as the size and scope of the public sector increased, that created very destructive economic and political dynamics.
More and more people got lured into the wagon of government dependency, which puts an ever-increasing burden on a shrinking pool of producers.
Meanwhile, organized interest groups such as government bureaucrats used their political muscle to extract absurdly excessive compensation packages, putting an even larger burden of the dwindling supply of taxpayers.
But that’s not the main focus of this post. Instead, I want to highlight a particular excerpt from the article and make a point about how too many people are blindly – perhaps willfully – ignorant of the Laffer Curve.
Check out this sentence.
Property tax collections are down 20 percent and income tax collections are down by more than a third in just the past five years — despite some of the highest tax rates in the state.
This is a classic “Fox Butterfield mistake,” which occurs when someone fails to recognize a cause-effect relationship. In this case, the reporter should have recognized that tax collections are down because Detroit has very high tax rates.
The city has a lot more problems than just high tax rates, of course, but can there be any doubt that productive people have very little incentive to earn and report taxable income in Detroit?
And that’s the essential insight of the Laffer Curve. Politicians can’t – or at least shouldn’t – assume that a 20 percent increase in tax rates will lead to a 20 percent increase in tax revenue. They also have to consider the degree to which a higher tax rate will cause a change in taxable income.
In some cases, higher tax rates will discourage people from earning more taxable income.
In some cases, higher tax rates will discourage people from reporting all the income they earn.
In some cases, higher tax rates will encourage people to utilize tax loopholes to shrink their taxable income.
In some cases, higher tax rates will encourage migration, thus causing taxable income to disappear.
Here’s my three-part video series on the Laffer Curve. Much of this is common sense, though it needs to be mandatory viewing for elected officials (as well as the bureaucrats at the Joint Committee on Taxation).
The Laffer Curve, Part I: Understanding the Theory
Uploaded by afq2007 on Jan 28, 2008
The Laffer Curve charts a relationship between tax rates and tax revenue. While the theory behind the Laffer Curve is widely accepted, the concept has become very controversial because politicians on both sides of the debate exaggerate. This video shows the middle ground between those who claim “all tax cuts pay for themselves” and those who claim tax policy has no impact on economic performance. This video, focusing on the theory of the Laffer Curve, is Part I of a three-part series. Part II reviews evidence of Laffer-Curve responses. Part III discusses how the revenue-estimating process in Washington can be improved. For more information please visit the Center for Freedom and Prosperity’s web site: http://www.freedomandprosperity.org
Part 2
Part 3
P.S. Just in case it’s not clear from the videos, we don’t want to be at the revenue-maximizing point on the Laffer Curve.
P.P.S. Amazingly, even the bureaucrats at the IMF recognize that there’s a point when taxes are so onerous that further increases don’t generate revenue.
P.P.P.S. At least CPAs understand the Laffer Curve, probably because they help their clients reduce their tax exposure to greedy governments.
P.P.P.P.S. I offered a Laffer Curve lesson to President Obama, but I doubt it had any impact.
___________________________
Thank you so much for your time. I know how valuable it is. I also appreciate the fine family that you have and your commitment as a father and a husband.
Sincerely,
Everette Hatcher III, 13900 Cottontail Lane, Alexander, AR 72002, ph 501-920-5733,
Williams with Sowell – Minimum Wage

Thomas Sowell
Thomas Sowell – Reducing Black Unemployment

—-

Related posts:
Dan Mitchell: Question of the Week: Has the European Fiscal Crisis Ended?
We got to cut spending or we will be in a fiscal crisis like Greece!!! Question of the Week: Has the European Fiscal Crisis Ended? January 12, 2013 by Dan Mitchell I’ve frequently commented on Europe’s fiscal mess and argued that excessive government spending is responsible for both the sovereign debt crisis and the economic stagnation […]
Taxes made simple by Dan Mitchell of the Cato Institute
The Flat Tax: How it Works and Why it is Good for America Uploaded by afq2007 on Mar 29, 2010 This Center for Freedom and Prosperity Foundation video shows how the flat tax would benefit families and businesses, and also explains how this simple and fair system would boost economic growth and eliminate the special-interest […]
Cartoons from Dan Mitchell’s blog that demonstrate what Obama is doing to our economy (Obama’s out of control spending not helped by raising taxes on rich)
I have put up lots of cartoons from Dan Mitchell’s blog before and they have got lots of hits before. Many of them have dealt with the economy, eternal unemployment benefits, socialism, Greece, welfare state or on gun control. President Obama really does think that all his answers lie in raising taxes on the rich when the […]
Dan Mitchell of the Cato Institute gives overview of economic policy and he praises Clinton and Reagan
__________ President Reagan, Nancy Reagan, Tom Selleck, Dudley Moore, Lucille Ball at a Tribute to Bob Hope’s 80th birthday at the Kennedy Center. 5/20/83. __________________________ Dan Mitchell is very good at giving speeches and making it very simple to understand economic policy and how it affects a nation. Mitchell also talks about slowing the growth […]
Cartoons from Dan Mitchell’s blog that demonstrate what Obama is doing to our economy (cartoon on entitlements)
The Laffer Curve – Explained Uploaded by Eddie Stannard on Nov 14, 2011 This video explains the relationship between tax rates, taxable income, and tax revenue. The key lesson is that the Laffer Curve is not an all-or-nothing proposition, where we have to choose between the exaggerated claim that “all tax cuts pay for themselves” […]
Open letter to President Obama (Part 296) (Laffer curve strikes again!!)
President Obama c/o The White House 1600 Pennsylvania Avenue NW Washington, DC 20500 Dear Mr. President, I know that you receive 20,000 letters a day and that you actually read 10 of them every day. I really do respect you for trying to get a pulse on what is going on out here. The way […]
Open letter to President Obama (Part 282, How the Laffer Curve worked in the 20th century over and over again!!!)
Dan Mitchell does a great job explaining the Laffer Curve President Obama c/o The White House 1600 Pennsylvania Avenue NW Washington, DC 20500 Dear Mr. President, I know that you receive 20,000 letters a day and that you actually read 10 of them every day. I really do respect you for trying to get a […]
Laffer curve hits tax hikers pretty hard (includes cartoon)
I have put up lots of cartoons from Dan Mitchell’s blog before and they have got lots of hits before. Many of them have dealt with the economy, eternal unemployment benefits, socialism, Greece, welfare state or on gun control. Today’s cartoon deals with the Laffer curve. Revenge of the Laffer Curve…Again and Again and Again March 27, 2013 […]
Editorial cartoon from Dan Mitchell’s blog on California’s sorry state of affairs
I have put up lots of cartoons from Dan Mitchell’s blog before and they have got lots of hits before. Many of them have dealt with the sequester, economy, eternal unemployment benefits, socialism, minimum wage laws, tax increases, social security, high taxes in California, Obamacare, Greece, welfare state or on gun control. President Obama’s favorite state must be California because […]
Portugal and the Laffer Curve
Class Warfare just don’t pay it seems. Why can’t we learn from other countries’ mistakes? Class Warfare Tax Policy Causes Portugal to Crash on the Laffer Curve, but Will Obama Learn from this Mistake? December 31, 2012 by Dan Mitchell Back in mid-2010, I wrote that Portugal was going to exacerbate its fiscal problems by raising […]
Political arguments against higher taxes from Dan Mitchell
Republicans would be stupid to raise taxes. Don’t Get Bamboozled by the Fiscal Cliff: Five Policy Reasons and Five Political Reasons Why Republicans Should Keep their No-Tax-Hike Promises December 6, 2012 by Dan Mitchell The politicians claim that they are negotiating about how best to reduce the deficit. That irks me because our fiscal problem is […]
President Obama ignores warnings about Laffer Curve
The Laffer Curve – Explained Uploaded by Eddie Stannard on Nov 14, 2011 This video explains the relationship between tax rates, taxable income, and tax revenue. The key lesson is that the Laffer Curve is not an all-or-nothing proposition, where we have to choose between the exaggerated claim that “all tax cuts pay for themselves” […]
Dan Mitchell looks at Obama’s tax record
Dan Mitchell’s article and the video from his organization takes a hard look at President Obama’s tax record. Dissecting Obama’s Record on Tax Policy October 30, 2012 by Dan Mitchell The folks at the Center for Freedom and Prosperity have been on a roll in the past few months, putting out an excellent series of videos […]
Dan Mitchell: “Romney is Right that You Can Lower Tax Rates and Reduce Tax Preferences without Hurting the Middle Class”
The Laffer Curve, Part I: Understanding the Theory Uploaded by afq2007 on Jan 28, 2008 The Laffer Curve charts a relationship between tax rates and tax revenue. While the theory behind the Laffer Curve is widely accepted, the concept has become very controversial because politicians on both sides of the debate exaggerate. This video shows […]
The Laffer Curve Wreaks Havoc in the United Kingdom
I got to hear Arthur Laffer speak back in 1981 and he predicted what would happen in the next few years with the Reagan tax cuts and he was right with every prediction. The Laffer Curve Wreaks Havoc in the United Kingdom July 1, 2012 by Dan Mitchell Back in 2010, I excoriated the new […]
Dan Mitchell: Maryland to Texas, but Not Okay to Move from the United States to Singapore?
You can’t blame someone for leaving one state for another if they have a better an opportunity to make money. Maryland to Texas, but Not Okay to Move from the United States to Singapore? July 12, 2012 by Dan Mitchell I’ve commented before about entrepreneurs, investors, and small business owners migrating from high tax states such […]
Liberals act like the Laffer Curve does not exist.
Raising taxes will not work. Liberals act like the Laffer Curve does not exist. The Laffer Curve Shows that Tax Increases Are a Very Bad Idea – even if They Generate More Tax Revenue April 10, 2012 by Dan Mitchell The Laffer Curve is a graphical representation of the relationship between tax rates, tax revenue, and […]
Dan Mitchell shows why soak-the-rich tax policy does not work
Dan Mitchell of the Cato Institute shows why Obama’s plan to tax the rich will not solve our deficit problem. Explaining in the New York Post Why Obama’s Soak-the-Rich Tax Policy Is Doomed to Failure April 17, 2012 by Dan Mitchell I think high tax rates on certain classes of citizens are immoral and discriminatory. If the […]
Dan Mitchell of the Cato Institute takes on liberals on PBS
You want the rich to pay more? Dan Mitchell observed:I explained that “rich” taxpayers declared much more income and paid much higher taxes after Reagan reduced the top tax rate from 70 percent to 28 percent. Liberals don’t understand good tax policies. Against 3-1 Odds, Promoting Good Tax Policy on Government TV April 12, 2012 by […]
Dan Mitchell of the Cato Institute takes on the Buffett Rule
Class warfare again from President Obama. Rejecting the Buffett Rule and Fighting Obama’s Class Warfare on CNBC April 10, 2012 by Dan Mitchell I’ve already explained why Warren Buffett is either dishonest or clueless about tax policy. Today, on CNBC, I got to debate the tax scheme that President Obama has named after the Omaha investor. […]
By Everette Hatcher III | Posted in Cato Institute, Taxes | Edit | Comments (0)
