–
The IMF, the Laffer Curve, and Supply-Side Economics
The Laffer Curve is a very straightforward concept.
It graphically illustrates why politicians are wrong if they think you can double tax revenue by doubling tax rates (or that revenues will drop by 50 percent if tax rates are cut in half).
Simply stated, you also have to look at what happens to taxable income.
In cases where taxpayers have a lot of control over the timing, level, and composition of their income, changes in tax rates may cause big changes in taxable income (or “tax base” in the jargon of economists).
None of this should be controversial. Even Paul Krugman agrees that the Laffer Curve exists.
Today, we are going to see that the pro-taxInternational Monetary Fund also admits there is a Laffer Curve.
Indeed, a new study authored by David Amaglobeli, Valerio Crispolti, and Xuguang Simon Sheng openly states that politicians should be very cognizant of the fact that some tax policy changes can have a big effect on the “tax base.”
This paper investigates the potential revenue impact of different tax policy changes using the Tax Policy Reform Database (TPRD)… Revenue responses to tax policy changes depend on many factors… However, one of most important factors
is the nature of the tax policy change itself. For example, while a tax rate cut will directly lower revenue intake, it could also encourage more economic activity, hence expand the tax base. Estimating the revenue response to a tax policy change, therefore, requires granular information on the nature of this change, including on the tax instrument used (e.g., VAT or personal income tax), the type of change adopted (e.g., tax base, tax rate), and its timing and size.
Here are some of the findings.
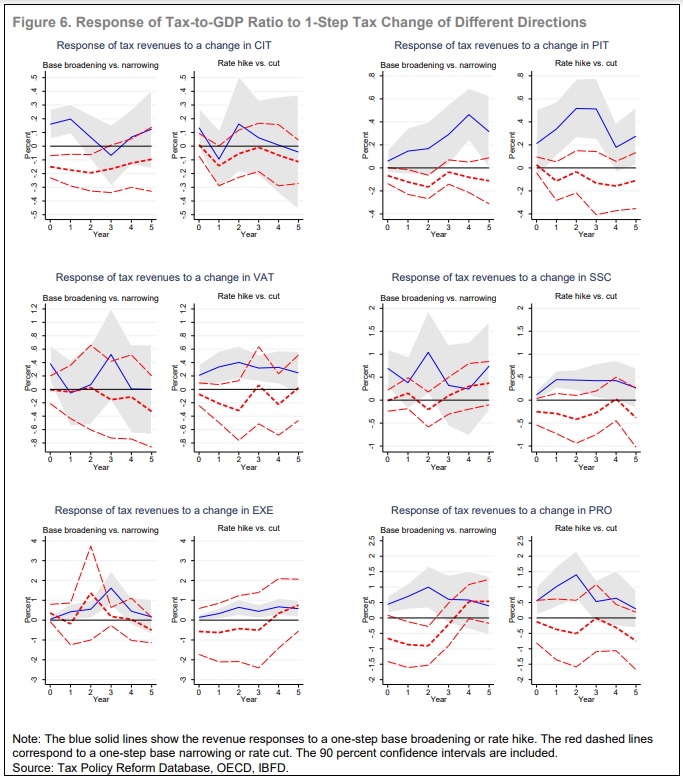
We assess the impact of tax policy changes on tax revenues using Jordà (2005)’s local projections method. Our baseline results are based on tax shocks identified in the year when a tax change is announced. Our main empirical findings suggest that the revenue yield of tax policy changes varies significantly across taxes and types of changes, with tax rate changes generally having a more transitory revenue impact than tax base changes for most taxes. Specifically, base broadening changes in PIT, CIT, EXE, and PRO have on average a more significant and long-lasting impact on tax collection than rate changes. At the same time, rate hikes have relatively more significant effects on taxes in the case of VAT and SSC measures.
Most notably, the report finds tax increases hurt prosperity, especially higher marginal tax rates.
Gechert and Groß (2019) conclude that measures to broaden the tax base are less harmful to economic growth than tax hikes. Dabla-Norris and Lima (2018) find that during fiscal consolidations, tax base-broadening measures lead to smaller output and employment declines compared to measures to increase tax rates.
And we learn that it is very foolish to raise corporate tax rates.
Mertens and Ravn (2013) find that…increases in CIT are approximately revenue neutral for the United States. …Announcements of CIT increases are associated with a somewhat transitory rise in tax collection, suggesting that companies have quickly adapted their business to reduce the tax burden.
For wonky readers, here’s a chart from the study. Note how, in many cases, there’s not much difference in revenue between tax increases (blue line) and tax cuts (red lines).
P.S. One big takeaway is that there is not a single Laffer Curve. There are multiple Laffer Curvesdepending on the tax that’s being changed and the ability of taxpayers to change their behavior.
P.P.S. A less-obvious takeaway is that class-warfare taxes cause the most economic damage, meaning the most harm to ordinary people.
P.P.P.S. You can call it the “Khaldun Curve” if you prefer.
P.P.P.P.S. I have trouble deciding what evidence is most powerful, the views of CPAs or the data from the OECD?
Corporate Tax Rates and Taxable Income
In the case of business taxation, the most visually powerful evidence for the Laffer Curve is what happened to corporate tax revenue in Ireland after the corporate tax rate was slashed from 50 percent to 12.5 percent.
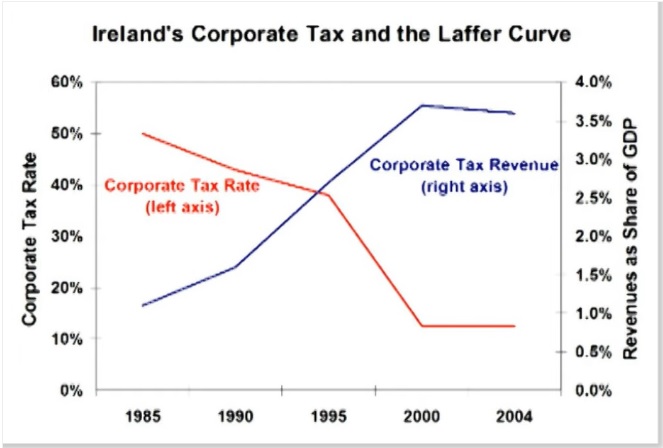 Tax revenue increased dramatically. Not just in nominal terms. Not just in inflation-adjusted terms.
Corporate receipts actually climbed as a share of GDP.
And this was during the decades when economic output was rapidly expanding.
In other words, the Irish government got a much bigger slice of a much bigger pie after tax rates were dramatically lowered.
Now let’s look at some evidence from a new study. Three professors from the University of Utah (Jeffrey Coles, Elena Patel, and Nather Seegert), and a Treasury Department economist (Matthew Smith) estimated what happens to taxable income for U.S. companies when there is a change in the corporate tax rate.
In response to a 10% increase in the expected marginal tax rate, private U.S. firms decrease taxable income by 9.1%, which indicates a discernibly more elastic response than prevailing estimates. This response reflects a decrease in taxable income of 3.0%
arising from real economic responses to a firm’s scale of operations and 6.1% arising from accounting transactions via (for example) revenue and expense timing. Responsiveness to the corporate tax rate is more elastic if a firm uses cash (9.9%) rather than accrual accounting (7.4%), if the firm is small (9.9%) rather than large (8.6%), and if the firm discounts future cash flows at a lower rate.
The paper is filled with equation, graphs, and jargon, but the above excerpt tells us everything we need to know.
When tax rates go up, taxable income goes down (both because there is less economic activity and because companies have more incentive to manipulate the tax code).
Thus confirming what I wrote back in 2016 about taxable income being the key variable.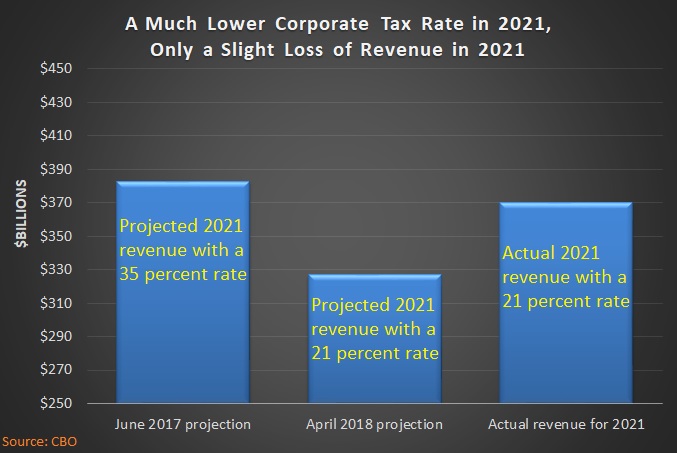
By the way, this does not mean that lower tax rates lead to more revenue. Or that higher tax rate produce less revenue.
Such big swings only happen in rare circumstances.
But it does mean that politicians will not grab as much money as they hope when they increase tax rates. And that they won’t lose as much revenue as they fear when they lower tax rates (and we saw that most recently with the 2017 tax reform).
I’ll close by noting that this is additional evidence for why we should be thankful that Biden’s proposal for higher corporate tax rates was not enacted.
P.S. The chart at the beginning of this column may be the most visually powerful evidence for the corporate Laffer Curve. The most empirically powerful evidence, however, comes from very unlikely sources – the pro-tax IMF and the pro-tax OECD.
March 3, 2021
President Biden c/o The White House
1600 Pennsylvania Avenue NW
Washington, DC 20500
Dear Mr. President,
______________________________
Dan Mitchell shows how ignoring the Laffer Curve is like running a stop sign!!!!
Can You Spell L-A-F-F-E-R C-U-R-V-E?
July 12, 2013 by Dan Mitchell
I’m thinking of inventing a game, sort of a fiscal version of Pin the Tail on the Donkey.
Only the way it will work is that there will be a map of the world and the winner will be the blindfolded person who puts their pin closest to a nation such asAustralia or Switzerland that has a relatively low risk of long-run fiscal collapse.
 That won’t be an easy game to win since we have data from the BIS, OECD, and IMF showing that government is growing far too fast in the vast majority of nations.
We also know that many states and cities suffer from the same problems.
A handful of local governments already have hit the fiscal brick wall, with many of them (gee, what a surprise) from California.
The most spectacular mess, though, is about to happen in Michigan.
The Washington Post reports that Detroit is on the verge of fiscal collapse.
After decades of sad and spectacular decline, it has come to this for Detroit: The city is $19 billion in debt and on the edge of becoming the nation’s largest municipal bankruptcy. An emergency manager says the city can make good on only a sliver of what it owes — in many cases just pennies on the dollar.
This is a dog-bites-man story. Detroit’s problems are the completely predictable result of excessive government. Just as statism explains the problems of Greece. And the problems of California. And the problems of Cyprus. And theproblems of Illinois.
I could continue with a long list of profligate governments, but you get the idea. Some of these governments are collapsing at a quicker pace and some at a slower pace. But all of them are in deep trouble because they don’t follow my Golden Rule about restraining the burden of government spending so that it grows slower than the private sector.
![]() Detroit obviously is an example of a government that is collapsing sooner rather than later.
Detroit obviously is an example of a government that is collapsing sooner rather than later.
Why? Simply stated, as the size and scope of the public sector increased, that created very destructive economic and political dynamics.
More and more people got lured into the wagon of government dependency, which puts an ever-increasing burden on a shrinking pool of producers.
Meanwhile, organized interest groups such as government bureaucrats used their political muscle to extract absurdly excessive compensation packages, putting an even larger burden of the dwindling supply of taxpayers.
But that’s not the main focus of this post. Instead, I want to highlight a particular excerpt from the article and make a point about how too many people are blindly – perhaps willfully – ignorant of the Laffer Curve.
Check out this sentence.
Property tax collections are down 20 percent and income tax collections are down by more than a third in just the past five years — despite some of the highest tax rates in the state.
This is a classic “Fox Butterfield mistake,” which occurs when someone fails to recognize a cause-effect relationship. In this case, the reporter should have recognized that tax collections are down because Detroit has very high tax rates.
The city has a lot more problems than just high tax rates, of course, but can there be any doubt that productive people have very little incentive to earn and report taxable income in Detroit?
And that’s the essential insight of the Laffer Curve. Politicians can’t – or at least shouldn’t – assume that a 20 percent increase in tax rates will lead to a 20 percent increase in tax revenue. They also have to consider the degree to which a higher tax rate will cause a change in taxable income.
In some cases, higher tax rates will discourage people from earning more taxable income.
In some cases, higher tax rates will discourage people from reporting all the income they earn.
In some cases, higher tax rates will encourage people to utilize tax loopholes to shrink their taxable income.
In some cases, higher tax rates will encourage migration, thus causing taxable income to disappear.
Here’s my three-part video series on the Laffer Curve. Much of this is common sense, though it needs to be mandatory viewing for elected officials (as well as the bureaucrats at the Joint Committee on Taxation).
The Laffer Curve, Part I: Understanding the Theory
Uploaded by afq2007 on Jan 28, 2008
The Laffer Curve charts a relationship between tax rates and tax revenue. While the theory behind the Laffer Curve is widely accepted, the concept has become very controversial because politicians on both sides of the debate exaggerate. This video shows the middle ground between those who claim “all tax cuts pay for themselves” and those who claim tax policy has no impact on economic performance. This video, focusing on the theory of the Laffer Curve, is Part I of a three-part series. Part II reviews evidence of Laffer-Curve responses. Part III discusses how the revenue-estimating process in Washington can be improved. For more information please visit the Center for Freedom and Prosperity’s web site: http://www.freedomandprosperity.org
Part 2
Part 3
P.S. Just in case it’s not clear from the videos, we don’t want to be at the revenue-maximizing point on the Laffer Curve.
P.P.S. Amazingly, even the bureaucrats at the IMF recognize that there’s a point when taxes are so onerous that further increases don’t generate revenue.
P.P.P.S. At least CPAs understand the Laffer Curve, probably because they help their clients reduce their tax exposure to greedy governments.
P.P.P.P.S. I offered a Laffer Curve lesson to President Obama, but I doubt it had any impact.
___________________________
Thank you so much for your time. I know how valuable it is. I also appreciate the fine family that you have and your commitment as a father and a husband.
Sincerely,
Everette Hatcher III, 13900 Cottontail Lane, Alexander, AR 72002, ph 501-920-5733,
Williams with Sowell – Minimum Wage

Thomas Sowell
Thomas Sowell – Reducing Black Unemployment

—-

Related posts:
Dan Mitchell: Question of the Week: Has the European Fiscal Crisis Ended?
We got to cut spending or we will be in a fiscal crisis like Greece!!! Question of the Week: Has the European Fiscal Crisis Ended? January 12, 2013 by Dan Mitchell I’ve frequently commented on Europe’s fiscal mess and argued that excessive government spending is responsible for both the sovereign debt crisis and the economic stagnation […]
Taxes made simple by Dan Mitchell of the Cato Institute
The Flat Tax: How it Works and Why it is Good for America Uploaded by afq2007 on Mar 29, 2010 This Center for Freedom and Prosperity Foundation video shows how the flat tax would benefit families and businesses, and also explains how this simple and fair system would boost economic growth and eliminate the special-interest […]
Cartoons from Dan Mitchell’s blog that demonstrate what Obama is doing to our economy (Obama’s out of control spending not helped by raising taxes on rich)
I have put up lots of cartoons from Dan Mitchell’s blog before and they have got lots of hits before. Many of them have dealt with the economy, eternal unemployment benefits, socialism, Greece, welfare state or on gun control. President Obama really does think that all his answers lie in raising taxes on the rich when the […]
Dan Mitchell of the Cato Institute gives overview of economic policy and he praises Clinton and Reagan
__________ President Reagan, Nancy Reagan, Tom Selleck, Dudley Moore, Lucille Ball at a Tribute to Bob Hope’s 80th birthday at the Kennedy Center. 5/20/83. __________________________ Dan Mitchell is very good at giving speeches and making it very simple to understand economic policy and how it affects a nation. Mitchell also talks about slowing the growth […]
Cartoons from Dan Mitchell’s blog that demonstrate what Obama is doing to our economy (cartoon on entitlements)
The Laffer Curve – Explained Uploaded by Eddie Stannard on Nov 14, 2011 This video explains the relationship between tax rates, taxable income, and tax revenue. The key lesson is that the Laffer Curve is not an all-or-nothing proposition, where we have to choose between the exaggerated claim that “all tax cuts pay for themselves” […]
Open letter to President Obama (Part 296) (Laffer curve strikes again!!)
President Obama c/o The White House 1600 Pennsylvania Avenue NW Washington, DC 20500 Dear Mr. President, I know that you receive 20,000 letters a day and that you actually read 10 of them every day. I really do respect you for trying to get a pulse on what is going on out here. The way […]
Open letter to President Obama (Part 282, How the Laffer Curve worked in the 20th century over and over again!!!)
Dan Mitchell does a great job explaining the Laffer Curve President Obama c/o The White House 1600 Pennsylvania Avenue NW Washington, DC 20500 Dear Mr. President, I know that you receive 20,000 letters a day and that you actually read 10 of them every day. I really do respect you for trying to get a […]
Laffer curve hits tax hikers pretty hard (includes cartoon)
I have put up lots of cartoons from Dan Mitchell’s blog before and they have got lots of hits before. Many of them have dealt with the economy, eternal unemployment benefits, socialism, Greece, welfare state or on gun control. Today’s cartoon deals with the Laffer curve. Revenge of the Laffer Curve…Again and Again and Again March 27, 2013 […]
Editorial cartoon from Dan Mitchell’s blog on California’s sorry state of affairs
I have put up lots of cartoons from Dan Mitchell’s blog before and they have got lots of hits before. Many of them have dealt with the sequester, economy, eternal unemployment benefits, socialism, minimum wage laws, tax increases, social security, high taxes in California, Obamacare, Greece, welfare state or on gun control. President Obama’s favorite state must be California because […]
Portugal and the Laffer Curve
Class Warfare just don’t pay it seems. Why can’t we learn from other countries’ mistakes? Class Warfare Tax Policy Causes Portugal to Crash on the Laffer Curve, but Will Obama Learn from this Mistake? December 31, 2012 by Dan Mitchell Back in mid-2010, I wrote that Portugal was going to exacerbate its fiscal problems by raising […]
Political arguments against higher taxes from Dan Mitchell
Republicans would be stupid to raise taxes. Don’t Get Bamboozled by the Fiscal Cliff: Five Policy Reasons and Five Political Reasons Why Republicans Should Keep their No-Tax-Hike Promises December 6, 2012 by Dan Mitchell The politicians claim that they are negotiating about how best to reduce the deficit. That irks me because our fiscal problem is […]
President Obama ignores warnings about Laffer Curve
The Laffer Curve – Explained Uploaded by Eddie Stannard on Nov 14, 2011 This video explains the relationship between tax rates, taxable income, and tax revenue. The key lesson is that the Laffer Curve is not an all-or-nothing proposition, where we have to choose between the exaggerated claim that “all tax cuts pay for themselves” […]
Dan Mitchell looks at Obama’s tax record
Dan Mitchell’s article and the video from his organization takes a hard look at President Obama’s tax record. Dissecting Obama’s Record on Tax Policy October 30, 2012 by Dan Mitchell The folks at the Center for Freedom and Prosperity have been on a roll in the past few months, putting out an excellent series of videos […]
Dan Mitchell: “Romney is Right that You Can Lower Tax Rates and Reduce Tax Preferences without Hurting the Middle Class”
The Laffer Curve, Part I: Understanding the Theory Uploaded by afq2007 on Jan 28, 2008 The Laffer Curve charts a relationship between tax rates and tax revenue. While the theory behind the Laffer Curve is widely accepted, the concept has become very controversial because politicians on both sides of the debate exaggerate. This video shows […]
The Laffer Curve Wreaks Havoc in the United Kingdom
I got to hear Arthur Laffer speak back in 1981 and he predicted what would happen in the next few years with the Reagan tax cuts and he was right with every prediction. The Laffer Curve Wreaks Havoc in the United Kingdom July 1, 2012 by Dan Mitchell Back in 2010, I excoriated the new […]
Dan Mitchell: Maryland to Texas, but Not Okay to Move from the United States to Singapore?
You can’t blame someone for leaving one state for another if they have a better an opportunity to make money. Maryland to Texas, but Not Okay to Move from the United States to Singapore? July 12, 2012 by Dan Mitchell I’ve commented before about entrepreneurs, investors, and small business owners migrating from high tax states such […]
Liberals act like the Laffer Curve does not exist.
Raising taxes will not work. Liberals act like the Laffer Curve does not exist. The Laffer Curve Shows that Tax Increases Are a Very Bad Idea – even if They Generate More Tax Revenue April 10, 2012 by Dan Mitchell The Laffer Curve is a graphical representation of the relationship between tax rates, tax revenue, and […]
Dan Mitchell shows why soak-the-rich tax policy does not work
Dan Mitchell of the Cato Institute shows why Obama’s plan to tax the rich will not solve our deficit problem. Explaining in the New York Post Why Obama’s Soak-the-Rich Tax Policy Is Doomed to Failure April 17, 2012 by Dan Mitchell I think high tax rates on certain classes of citizens are immoral and discriminatory. If the […]
Dan Mitchell of the Cato Institute takes on liberals on PBS
You want the rich to pay more? Dan Mitchell observed:I explained that “rich” taxpayers declared much more income and paid much higher taxes after Reagan reduced the top tax rate from 70 percent to 28 percent. Liberals don’t understand good tax policies. Against 3-1 Odds, Promoting Good Tax Policy on Government TV April 12, 2012 by […]
Dan Mitchell of the Cato Institute takes on the Buffett Rule
Class warfare again from President Obama. Rejecting the Buffett Rule and Fighting Obama’s Class Warfare on CNBC April 10, 2012 by Dan Mitchell I’ve already explained why Warren Buffett is either dishonest or clueless about tax policy. Today, on CNBC, I got to debate the tax scheme that President Obama has named after the Omaha investor. […]
By Everette Hatcher III | Posted in Cato Institute, Taxes | Edit | Comments (0)
